6 people have favorited this lesson!
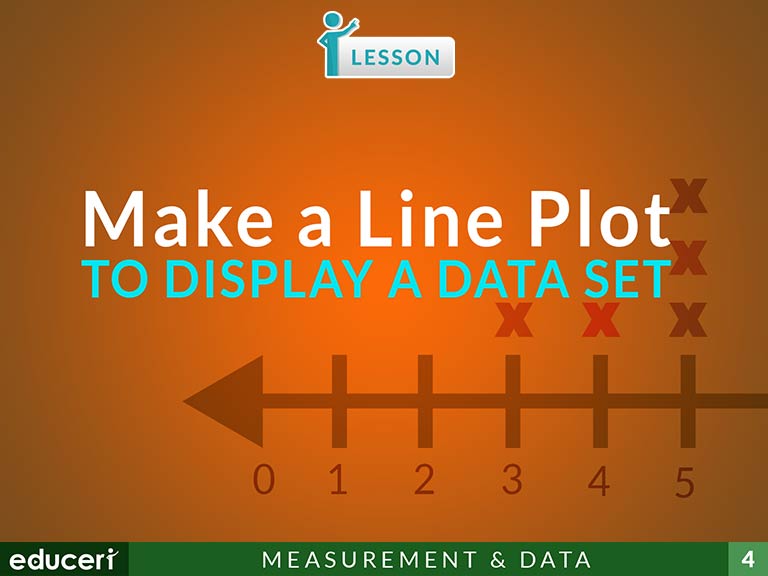
4.MD.4 Make a line plot to display a data set of measurements in fractions of a unit (1/2, 1/4, 1/8). Solve problems involving addition and subtraction of fractions by using information presented in line plots. For example, from a line plot find and interpret the difference in length between the longest and shortest specimens in an insect collection.
Log in to view this lesson. If you do not have an account, subscribe now and begin your free 30 day trial.