< Back to Concept Index
Lessons tagged with "3.MD.3"
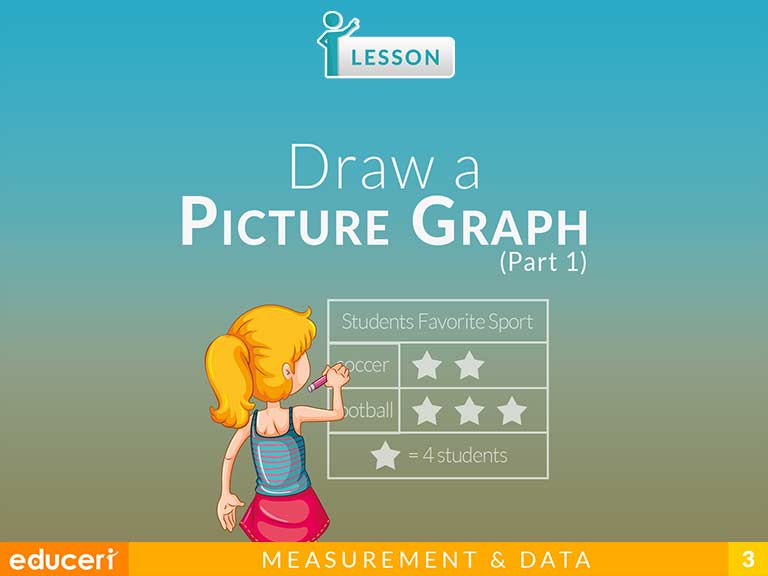
Draw a Picture Graph
- Grade:
- 3
- Subject:
- Math
This measurement and data lesson covers how to draw a picture graph. The lesson includes research-based strategies and strategic questions that prepare students for assessments. In this lesson, students will read the given data set, write the given categories in the picture graph, and determine how many pictures to draw for each category by dividing the category value by the key value.
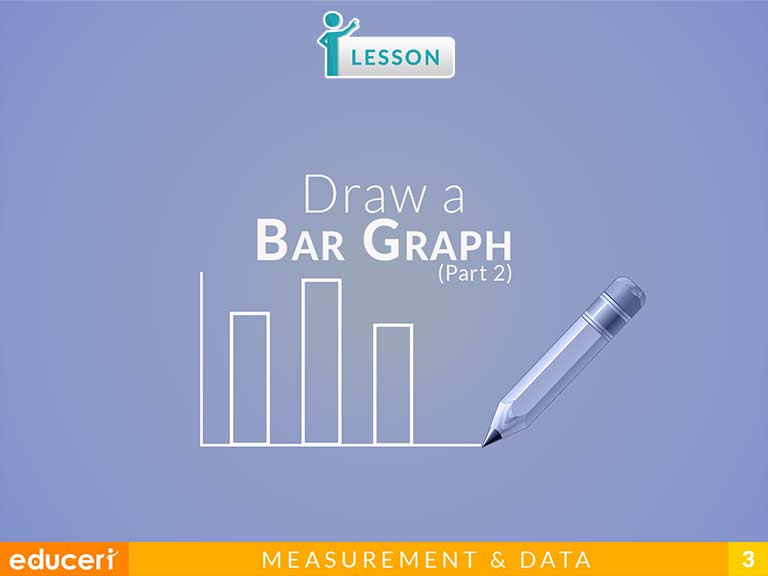
Draw a Bar Graph
- Grade:
- 3
- Subject:
- Math
This measurement and data lesson covers how to draw a bar graph. The lesson includes research-based strategies and strategic questions that prepare students for assessments. In this lesson, students will read the given data set, write the given categories in the bar graph, and determine how high to draw the bar.