All Lessons
Factor Quadratic Expressions - Part 1
(8) Quadratic functions and equations. The student applies the mathematical process standards to solve, with and without technology, quadratic equations and evaluate the reasonableness of their solutions. The student formulates statistical relationships and evaluates their reasonableness based on real-world data.
A1.8.A(A) Solve quadratic equations having real solutions by factoring, taking square roots, completing the square, and applying the quadratic formula
Share This Lesson
Factor Quadratic Expressions - Part 2
(8) Quadratic functions and equations. The student applies the mathematical process standards to solve, with and without technology, quadratic equations and evaluate the reasonableness of their solutions. The student formulates statistical relationships and evaluates their reasonableness based on real-world data.
A1.8.A(A) Solve quadratic equations having real solutions by factoring, taking square roots, completing the square, and applying the quadratic formula
Share This Lesson
Solve Exponential Equations
(C) Write exponential functions in the form f(x) = abx (where b is a rational number) to describe problems arising from mathematical and real-world situations, including growth and decay
A2.5.D(D) Solve exponential equations of the form y = abx where a is a nonzero real number and b is greater than zero and not equal to one and single logarithmic equations having real solutions
PCAL.5.I(I) Generate and solve exponential equations in mathematical and real-world problems
Share This Lesson
Simplify Expressions in Equations
Share This Lesson
Solve Quadratic Equations by Completing the Square
HSA.REI.4.A Use the method of completing the square to transform any quadratic equation in x into an equation of the form (x - p)2 = q that has the same solutions. Derive the quadratic formula from this form.
HSA.REI.4.BHSA.REI.4.B Solve quadratic equations by inspection (e.g., for x^2 = 49), taking square roots, completing the square, the quadratic formula and factoring, as appropriate to the initial form of the equation. Recognize when the quadratic formula gives complex solutions and write them as a ± bi for real numbers a and b.
Share This Lesson
Solve Linear Equation Word Problems
Share This Lesson
Graph Linear Functions by Plotting Ordered Pairs
(C) Contrast bivariate sets of data that suggest a linear relationship with bivariate sets of data that do not suggest a linear relationship from a graphical representation
A1.3.C(C) Graph linear functions on the coordinate plane and identify key features, including x-intercept, y-intercept, zeros, and slope, in mathematical and real-world problems
8.EE.6 Use similar triangles to explain why the slope m is the same between any two distinct points on a non-vertical line in the coordinate plane; derive the equation y = mx for a line through the origin and the equation y = mx + b for a line intercepting the vertical axis at b.
HSA.REI.10HSA.REI.10 Understand that the graph of an equation in two variables is the set of all its solutions plotted in the coordinate plane, often forming a curve (which could be a line).
HSF.IF.7.AHSF.IF.7.A Graph linear and quadratic functions and show intercepts, maxima, and minima.
This expressions and equations lesson teaches students how to graph linear functions by plotting ordered pairs. The lesson includes research-based strategies and strategic questions that prepare students for assessments. In this lesson, students will plot ordered pairs from a linear function on the coordinate plane.
Share This Lesson
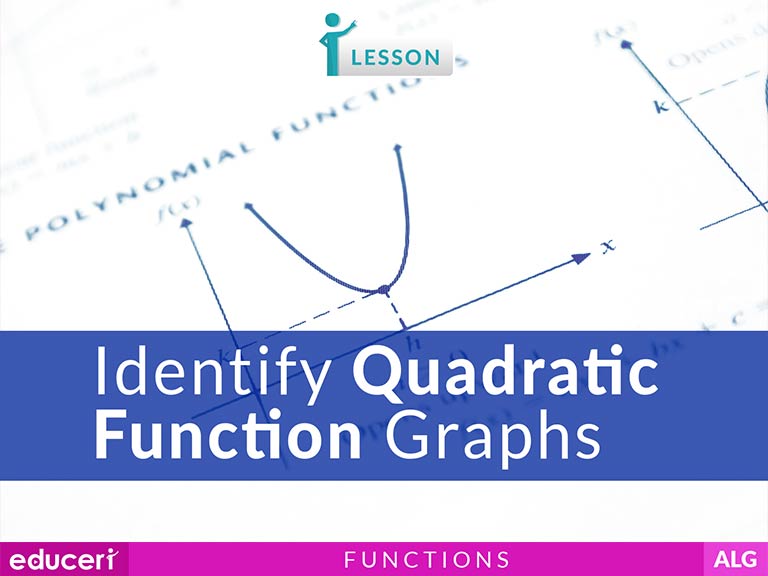
Identify Quadratic Function Graphs
(7) Quadratic functions and equations. The student applies the mathematical process standards when using graphs of quadratic functions and their related transformations to represent in multiple ways and determine, with and without technology, the solutions to equations.
A1.7.A(A) Graph quadratic functions on the coordinate plane and use the graph to identify key attributes, if possible, including x-intercept, y-intercept, zeros, maximum value, minimum values, vertex, and the equation of the axis of symmetry
A1.7.B(B) Describe the relationship between the linear factors of quadratic expressions and the zeros of their associated quadratic functions
A1.7.C(C) Determine the effects on the graph of the parent function f(x) = x2 when f(x) is replaced by af(x), f(x) + d, f(x - c), f(bx) for specific values of a, b, c, and d.
Share This Lesson
Evaluate Functions
(Y11-12) Substitute numerical values into algebraic expressions; for example, substitute different values of x to evaluate the expressions 3x/5, 5(2x - 4) (ACMEM035)
ACMEM122(Y11-12) Generate tables of values for linear functions, including for negative values of x (ACMEM122)
ACMEM124(Y11-12) Interpret and use graphs in practical situations, including travel graphs and conversion graphs (ACMEM124)
Share This Lesson
Evaluate and Graph Functions
Share This Lesson

Find the Input Value of a Function Given the Output
HSF.IF.1 Understand that a function from one set (called the domain) to another set (called the range) assigns to each element of the domain exactly one element of the range. If f is a function and x is an element of its domain, then f(x) denotes the output of f corresponding to the input x. The graph of f is the graph of the equation y = f(x).
HSF.IF.2HSF.IF.2 Use function notation, evaluate functions for inputs in their domains, and interpret statements that use function notation in terms of a context.
Share This Lesson
Identify Function Types
This interpreting functions lesson teaches students how to identify different types of functions. The lesson includes research-based strategies and strategic questions that prepare students for assessments. In this lesson, students will identify the attributes of a function and its graph to determine which type of function it is.
Share This Lesson
Plot Function Types
HSF.IF.7 Graph functions expressed symbolically and show key features of the graph, by hand in simple cases and using technology for more complicated cases.*
HSF.IF.7.AHSF.IF.7.A Graph linear and quadratic functions and show intercepts, maxima, and minima.
HSF.IF.7.CHSF.IF.7.C Graph polynomial functions, identifying zeros when suitable factorizations are available, and showing end behavior.
HSF.IF.7.EHSF.IF.7.E Graph exponential and logarithmic functions, showing intercepts and end behavior, and trigonometric functions, showing period, midline, and amplitude.
This interpreting functions lesson teaches students how to plot different types of functions on the coordinate plane. The lesson includes research-based strategies and strategic questions that prepare students for assessments. In this lesson, students will determine the type of function, evaluate the function for a variety of values, and plot the results onto the coordinate plane.
Share This Lesson
Convert Between Linear Function Notation and x-y Notation
This interpreting functions lesson teaches students how to convert between linear function notation and x-y notation. The lesson includes research-based strategies and strategic questions that prepare students for assessments. In this lesson, students will rewrite functions using different notations. Students will also demonstrate that the two notations describe the same line.
Share This Lesson
Identify the Domain & Range of Functions
Share This Lesson
Identify and Graph Transformed Functions
(E) Determine the effects on the graph of the parent function f(x) = x when f(x) is replaced by af(x), f(x) + d, f(x - c), f(bx) for specific values of a, b, c, and d
A1.7.C(C) Determine the effects on the graph of the parent function f(x) = x2 when f(x) is replaced by af(x), f(x) + d, f(x - c), f(bx) for specific values of a, b, c, and d.
Share This Lesson
Find Zeros of Quadratic Functions by Factoring
(7) Quadratic functions and equations. The student applies the mathematical process standards when using graphs of quadratic functions and their related transformations to represent in multiple ways and determine, with and without technology, the solutions to equations.
A1.7.B(B) Describe the relationship between the linear factors of quadratic expressions and the zeros of their associated quadratic functions
HSF.IF.8 Write a function defined by an expression in different but equivalent forms to reveal and explain different properties of the function.
HSF.IF.8.AHSF.IF.8.A Use the process of factoring and completing the square in a quadratic function to show zeros, extreme values, and symmetry of the graph, and interpret these in terms of a context.
Share This Lesson
Determine Whether a Relation is a Function
This Algebra 1 lesson teaches students how to whether a relation is a function. The lesson includes research-based strategies and strategic questions that prepare students for assessments. Students will identify the relation as a function if each domain value matches exactly one range value, and identify any ordered pairs that prevent the relation from being a function. Finally, they will interpret the solution. In addition to the lesson, there is one page of Independent Practice and three pages of periodic review.
Share This Lesson